


Q1 2026 New Car Insights
Read what we learned during Q1 below:
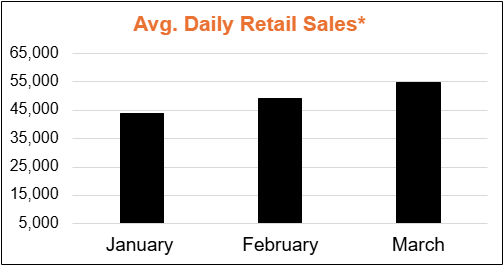
1) 3-Month Sales Trend (Avg. Daily Retail Sales)
Insight: Retail sales accelerated steadily from January to March, rising 25% overall. This signals improving demand supported by better inventory availability and seasonal momentum. While some lift is seasonal, the pace increase shows the market is rewarding dealers who are aligned on mix and speed.
Action:
- Keep tight alignment between incoming inventory and high‑turn trims.
- Alert your market of in‑transit inventory to capture demand while supply is tightening.
2) Average Transaction Price (ATP)
Insight: Transaction prices stayed essentially flat across Q1. Volume increased without meaningful price lift, suggesting affordability sensitivity remains and sales gains are being driven by availability, incentives, or mix rather than higher prices.
Action:
- Protect gross through vehicle mix discipline, not price hikes. Favor trims and packages that hold margin.
- Guide shoppers to higher‑value configurations without broad discounting.
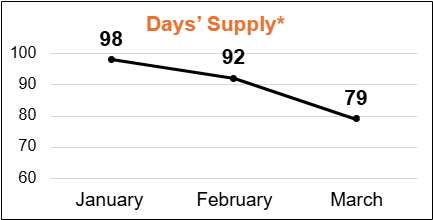
3) Days’ Supply
Insight: Days’ supply tightened from 98 to 79 days while sales accelerated. This is a healthy setup for turn and floorplan efficiency and indicates inventory is moving faster.
Action:
- Prioritize fast‑turn colors, trims, and option packages when ordering or allocating.
- Enforce a 30‑/60‑/90‑day pricing strategy to stay ahead of aging as supply tightens.
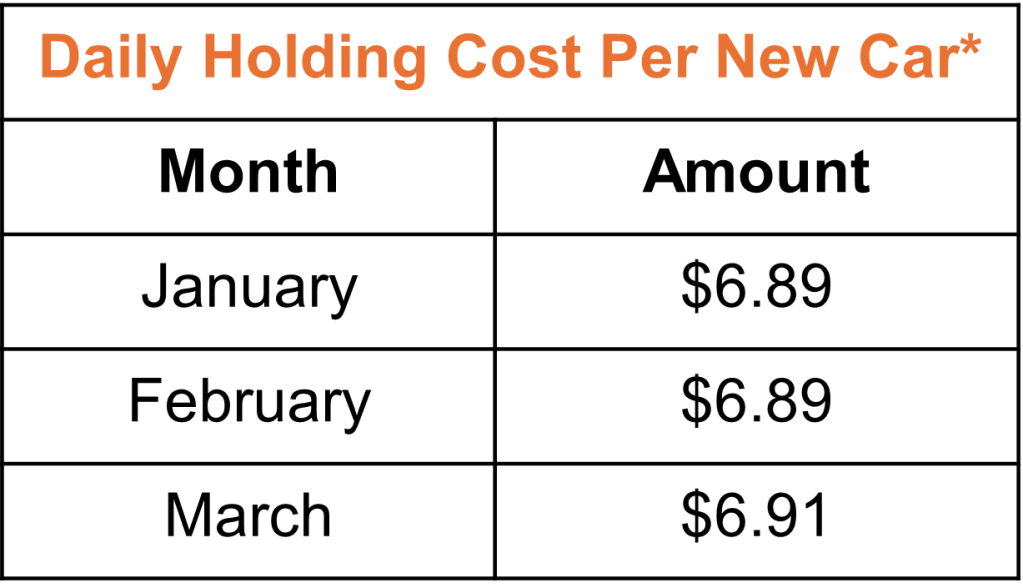
4) Daily Holding Cost per New Car
Insight: Daily holding cost remained flat, but lower days’ supply means total carrying expense per unit is improving. Faster turn is doing more to protect profit than cost reductions alone.
Action:
- Track time‑to‑frontline closely, with a goal of under 48 hours.
- Improve merchandising with immersive VDPs that include strong photos to clearly call-out popular features/packages, payment options and reasons to buy from you.
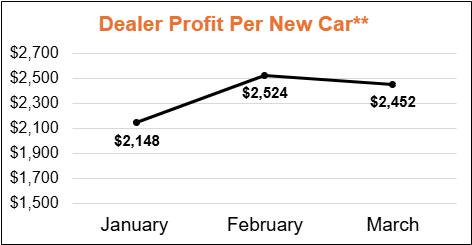
5) Dealer Profit per New Car
Insight: Profit per unit peaked in February before softening slightly in March. This pattern suggests dealers maximized incentives or discounting to sustain volume as demand improved.
Action:
- Protect profit on top‑selling segments and use incentives purposely on slower movers.
- Align pricing by segments and respective turn rates, rather than across your entire lot.
Q1 2026 Used Car Insights
Read what we learned during Q1 below:
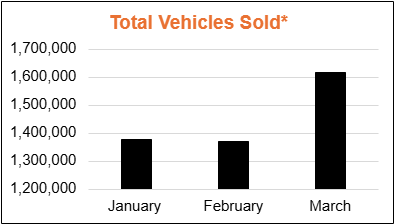
1) Total Vehicles Sold
Insight: Used vehicle sales dipped slightly in February, then surged in March, finishing the quarter strong. This points to resilient demand returning quickly once inventory and pricing aligned with shopper expectations.
Action:
- Plan inventory for consistency, not spikes. Focus on turn and conversion efficiency.
- Merchandise early and avoid letting slow movers linger as demand shifts month to month.
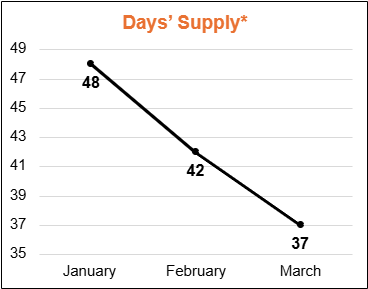
2) Days’ Supply
Insight: Used days’ supply tightened from 48 to 37 days, signaling faster turn and a more competitive sourcing environment. Inventory mistakes will surface faster in a tight supply market.
Action:
- Target a store‑level supply of 35–45 days to balance choice and speed.
- Use early aging triggers—low lead volume, online engagement—to act before vehicles stall.
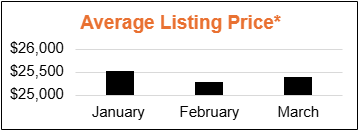
3) Average Listing Price
Insight: Listing prices dipped in February and stabilized in March, showing pricing resistance. Buyers are active, however price‑sensitive.
Action:
- Price to market from day one, especially on sub‑$25K units.
- Lead with payment‑based merchandising to match how shoppers are sorting and comparing.
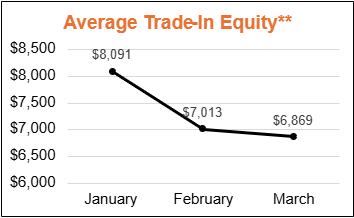
4) Average Trade-In Equity
Insight: Trade‑in equity declined steadily across the quarter, down 15% from January. Customers still have equity, but less room to absorb pricing gaps.
Action:
- Set realistic expectations early in the deal to keep transactions moving.
- It’s not always true that service vehicles take less money to recondition. It is true that when dealers are aware of a service customer’s equity position, assuming it’s positive, they can make stronger offers to acquire the vehicles.
Sources:
* Cox Automotive Insights
** J.D. Power
Need to catch up? View our archived insights here.
Interested in a Demo?
Fill out this form to request a personalized demo of any or our solutions.
"*" indicates required fields